
Profile analysis is a multi-variance equation of the frequent measurement or one mixed (ANOVA). This method is a quantitative method to analyze the statistical data. The profile analysis is used in the following cases:
- Comparing the similar independent variable among the groups in some time units.
- When there are various measurements for similar variables (for example some various psychological tests that investigate the depression). Profile analysis uses a data diagram to compare visually in the groups. We can use various equations to test the effects’ meaningfulness.
What is the profile analysis objective?
Profile analysis aids the researchers to identify whether two or some groups of the examinees present a meaningful profile or distinguished record or not. This will aid the exam patterns’ analysis, sub-exams, or scores. The profile analysis may be used for various groups or one person’s score.
What is its meaning?
The profile analysis addresses the profile diagram or record diagram. One record diagram shows the average score of the examinees’ group with the next group of the examinees by considering all the existing items. The main aim of the record analysis is to specify how much one experiment is good and independent. Typically each test includes various measurements and is done during the time. You can use a simple ANOVA table to compare the test cases. However, this will violate the independent supposition from two points of view. First, the relevant amount to each item is not independent because the item groups are designed the way they have a high correlation. Then if you design a test to predict the membership in the group (for example, being depressed or not, the possibility of success in the university) you intend to have the best prediction in each group about its results. Therefore, classifying the items and group membership are not independent.
Applying the Profile Analysis
In the process analysis or record analysis, the data are entered in the system the way time points, observation, experiment, and so on are in X, and on the contrary of the variable response, the scores are presented on Y-axis. Then the specified point on the diagram turns into the linear profile. The lines present the obtained score during the time or related scores to the various experiments for each group. The profile analysis addresses three fundamental questions related to the data diagram:
- Are the groups in various time points or various aligned observation and parallel?
- Are the groups in various time points or various observations at equal levels?
- Do the profiles in various time points or various observations seem flat?
If the response to the questions is no, (or considered null-hypothesis is rejected) we say there is a meaningful effect. The type of this effect depends on the fact that which null-hypothesis will be rejected.
Equal Levels
The supposition that whether profiles have equal levels or not is the most important one between the profile analysis tests. The main question of the test is that if one of the groups gets a high score averagely in all measurements or time periods.
The main average of all time point or measurement is calculated for each group to analyze this hypothesis. Since all the scores or time periods are positioned in one parameter under the title of the group main average and this test is one-variable test. Basically, this is equal to intra-group main effect.
Here, some diagrams are presented to aid visualizing the equal levels.
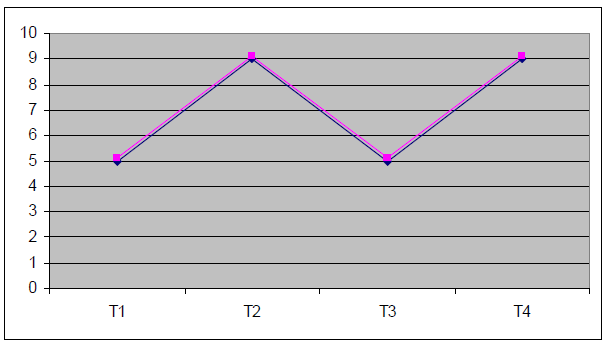 Diagram 1. (Identical)- There isn’t intra-group effect
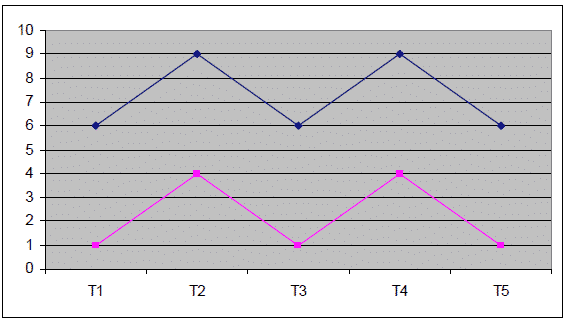
Diagram 2. Non equal levels (Non-identical). There is an intra-group effect
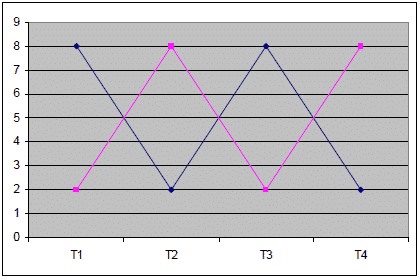
Diagram 3- The equal levels- There isn’t intra-group effect. Although the profiles are not identical the average quantity of the responses variables is equal to each group and it must be taken into account.
We can obtain easily the relative intra-group and inter-group association mathematically and by using the error square calculation (the left side equation). This type of calculation should sound familiar since the base work is using ANOVA.
For group I, the j number dependent variables were measured.
 If the group levels have meaningful discrepancies the null-hypothesis of the levels’ equality is rejected.
Flatness
Being flat and parallel is a multi-variable test that compares the profiles’ various parts. Here one part or section is the difference in response to the time point and dependent variables. Therefore, the gradient between the two points is X on the axis. Flatness null-hypothesis is that the parts are zero it means the gradients of each part are zero and the profile is flat. This test is evaluated independently for each group and is an inter-group test. If the line is not straight (each part is different from zero). In this case, the inter-group effect is related to the time point, dependent variable, and measurement.
MANOVA test is utilized to test the classified data for each group. Typically T² Hotelling is used here:
Hotelling’s T2 = N (GM)’Swg-1 (GM)
In which N is the number o0f thee parts, GM is the average and Swg of the inter-group variance and covariance Matrix.
λ can be calculated by using T and according to the equation below:
Parallelism
Being parallel is the main test that propels us to utilize the profile analysis. Parallel tests whether each part is identified in each group.
Here are some parallel concepts:
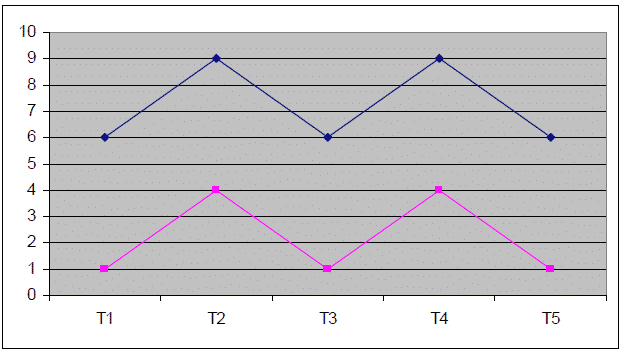
Diagram 1. Parallel Inter- Group and intra-group association
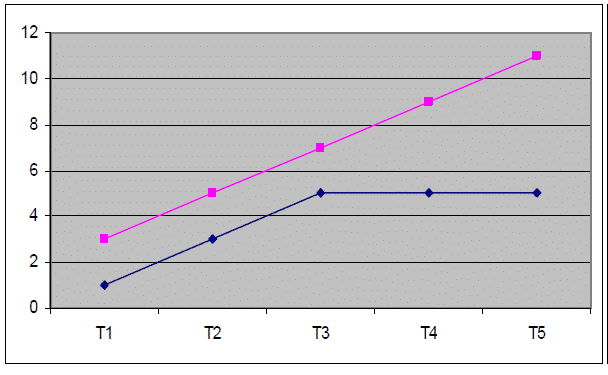
Diagram 2. Non-parallel. There is intra-group and inter-group association.
MANOVA is used to investigate if there is a meaningful intra-group correlation. The inter-group variance is obtained by subtracting the Matrix of each person from the group average. The intra-group variance is also obtained by subtracting the average Matrix of each group from the big average Matrix. If the parallel hypothesis is rejected there will be a meaningful group with the DV interaction.
Nevertheless, the profile analysis has particular limitations when it comes to measuring the standard error or predicting the score of each person.
The replacements that are for the profile analysis are the multi-faucet scale method and Q-Analysis. In Q-Analysis the score of a person in the determined group is considered as an independent block (As we have in profile analysis). However, Q-Analysis, and analysis implement the rotational element in these blocks. The relevant extracting factors and ideas are signed